Acquiring Sentinel‑2 Imagery Using AIS Vessel Data
Python script that retrieves AIS vessel event locations from Global Fishing Watch and uses Google Earth Engine to download matching Sentinel‑2 satellite images.
- 3 min read
Introduction
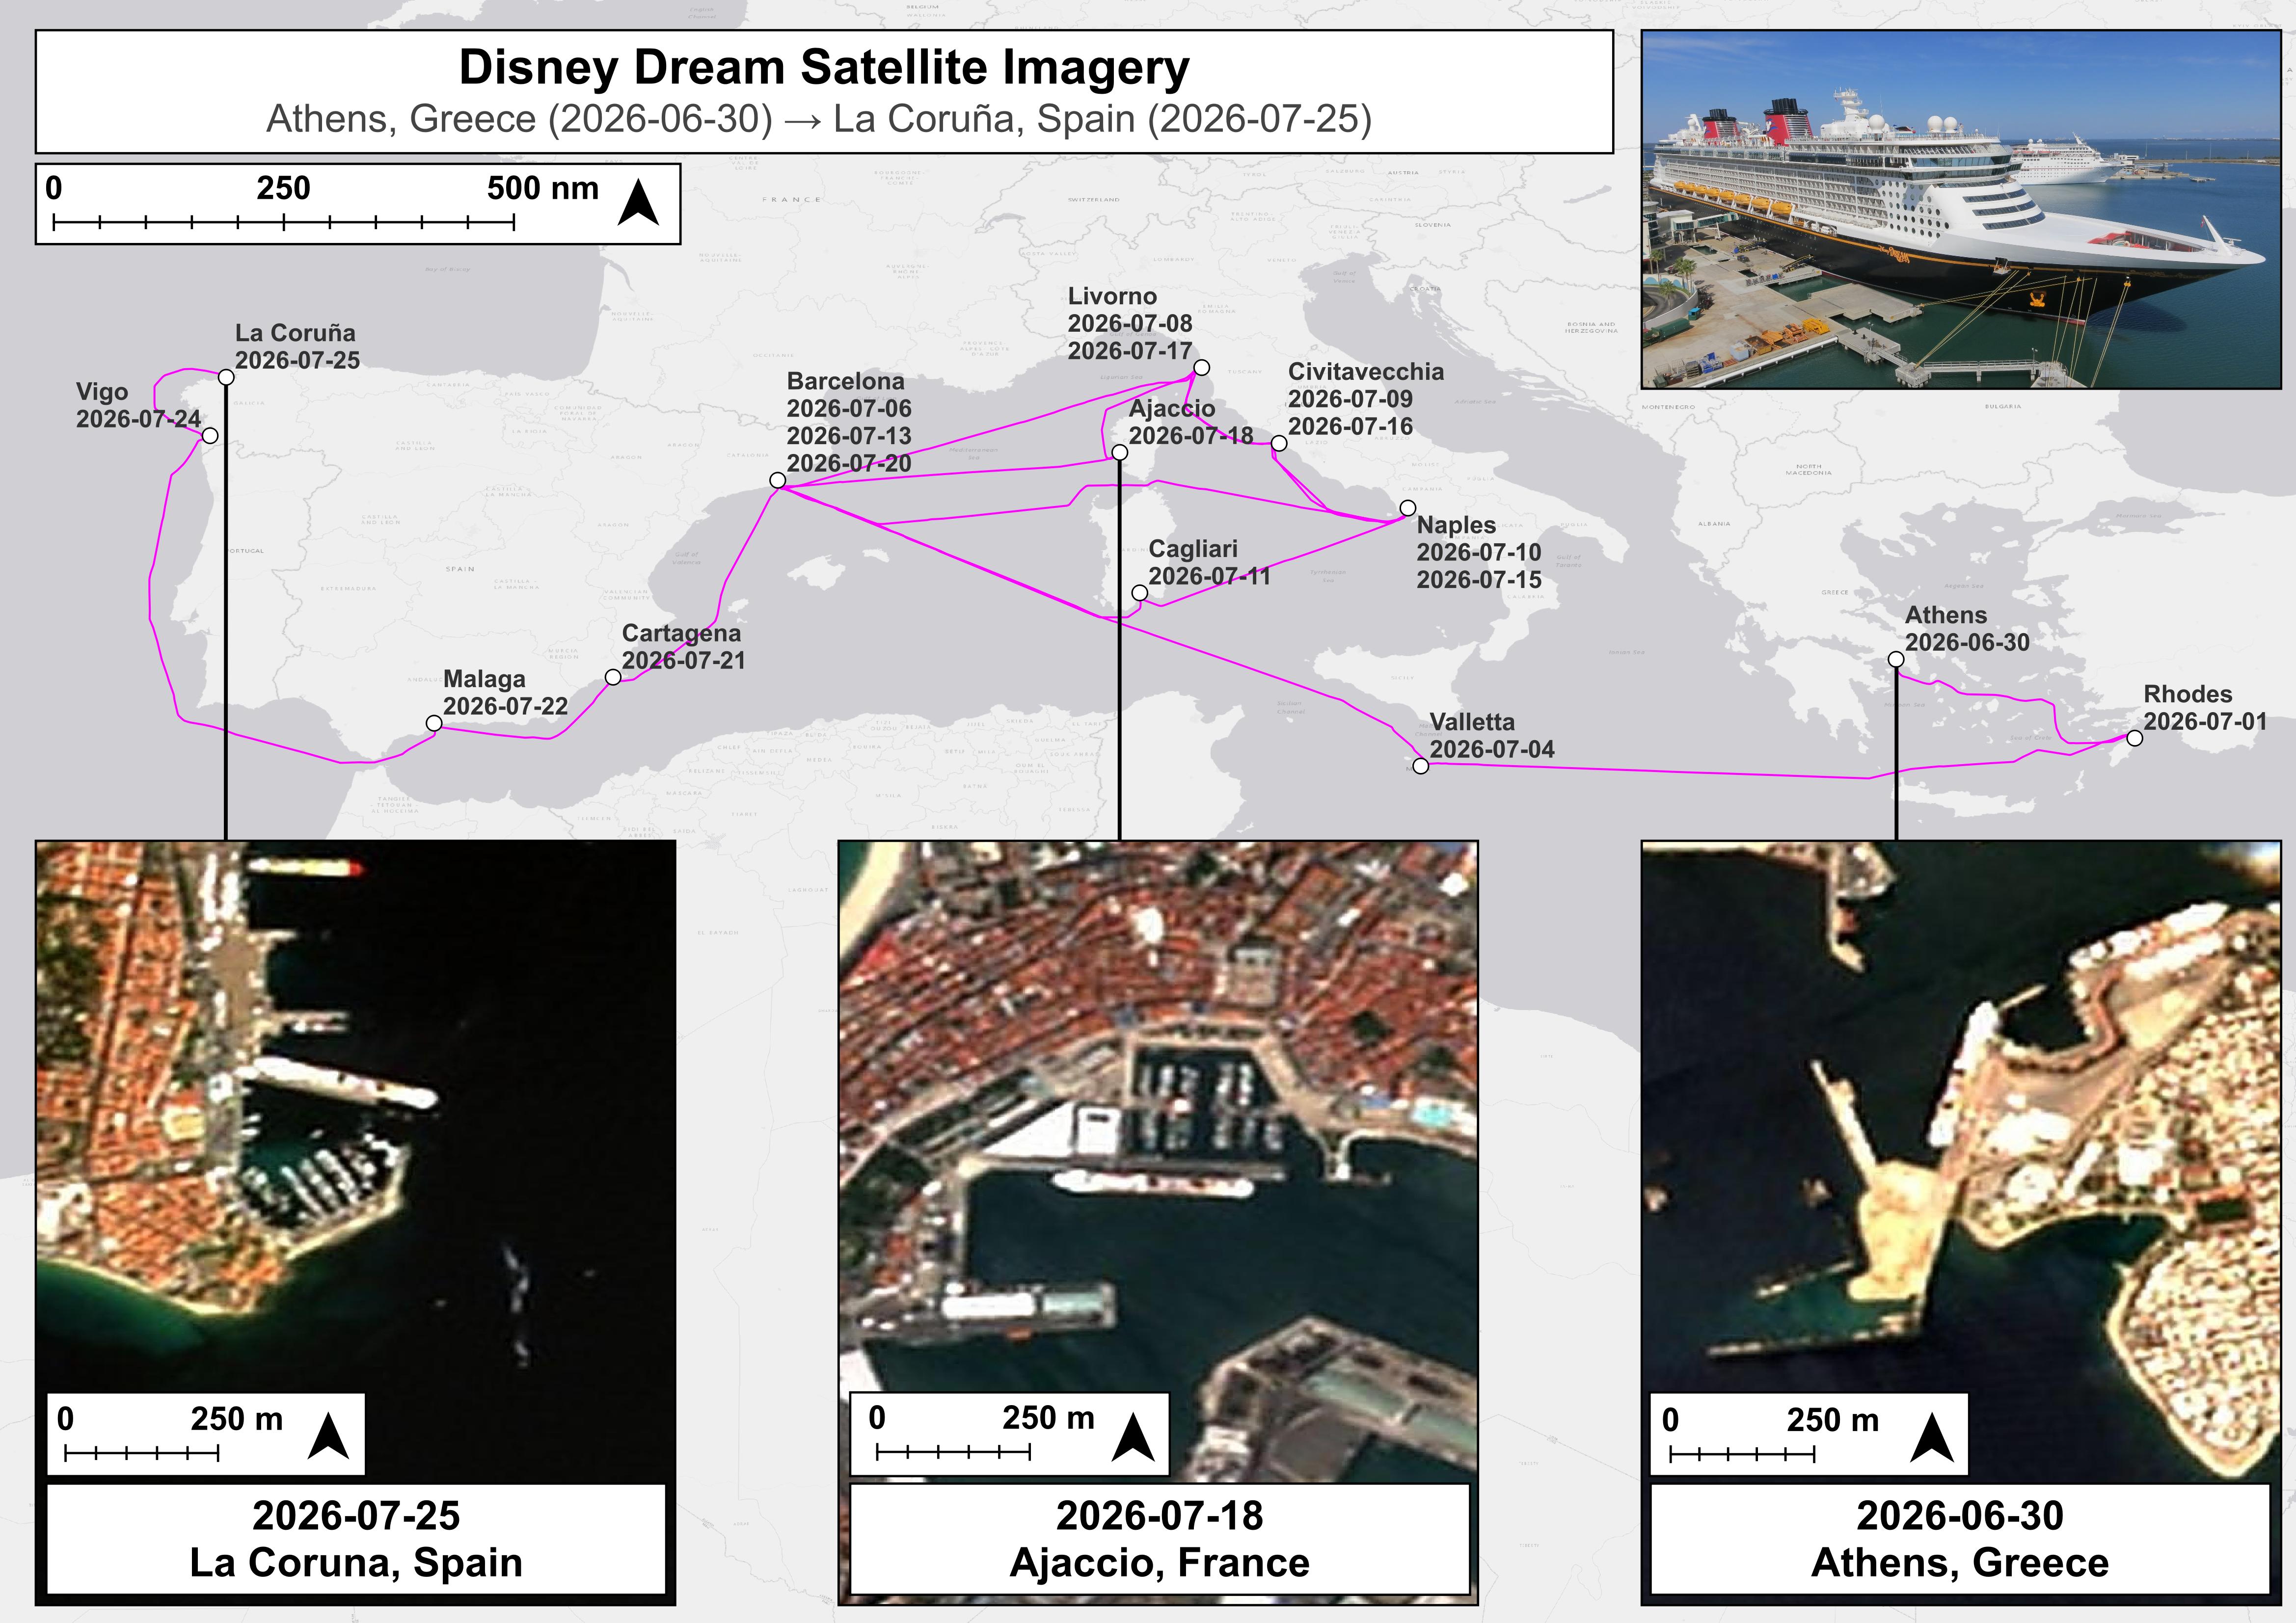
After seeing BBC articles featuring satellite images of specific vessels, I became curious about how these images were obtained. After researching available approaches, I found good results using the below workflow. Europe’s recent heat wave provided an ideal window of low cloud coverage, and the Disney Dream’s summer European itinerary meant multiple port visits would offer plenty of opportunities for image capture.
This project demonstrates a fully automated workflow for acquiring and processing Sentinel-2 satellite imagery using vessel movement data from the Global Fishing Watch API. By combining automatic identification system (AIS) vessel events with Google Earth Engine’s satellite imagery repository, the workflow creates a comprehensive dataset of geospatially referenced satellite images. The imagery is further enhanced through upscaling, sharpening, and gamma correction to improve visual quality and analytical utility.
1. Import Python Libraries and Setting Up Parameters
Key Libraries:
- ee
- geemap
- gfwapiclient
- PIL
- cv2
- pandas
- cartopy
- numpy
- matploblib
- json
- shutil
- dotenv
- datetime
Example parameters:
- max_downloads = 1000
- vessel_name = ‘Disney_Dream’
- vessel_mmsi = ‘311042900’
- start_date = “2026-01-01”
- end_date = “2026-08-22”
2. Authenticating and Querying the Global Fishing Watch API
Loaded GFW API access token from an environment file and created the client. The API requires an authentication token, vessel MMSI (Maritime Mobile Service Identities), and a date range.
The API returned all the port-visits, encounters, and loitering events within the date range. Geometry was flattened into simple lat and lon columns and a DataFrame of AIS events was generated.
3. Preparing Earth Engine and Downloading Sentinel‑2 Imagery
For each AIS event, a bounding box was created around each of the coordinates to define the extents of returned satellite image.
The COPERNICUS/S2_SR_HARMONIZED collection was queried, filtered by date and cloud cover, selected RGB bands, and downloaded all matching images as JPEGs.
A limitation of the Google Earth Engine Sentinel-2 database is that it provides only the acquisition date, not the time of capture. This means an image could be matched to a vessel event even if it was captured hours before or after the actual event occurred, as long as both fell on the same day. All encounter and loitering event coordinates returned images without the Disney Dream visible. Port-visit coordinates proved significantly more reliable for capturing images of the vessel.
4. Generating Geospatial Sidecar Files
For each downloaded JPEG, sidecar files were generated:
- a .jgw world file
- a .prj projection file (EPSG:4326)
- a .geojson metadata file containing bounding box, acquisition date, cloud percentage, and AIS event metadata
This allowed me to display the georeferenced images easily inside QGIS.
5. Image Enhancement
To improve image clarity as much as I could, I applied a series of enhancement techniques to each downloaded JPEG. I first upscaled the image by 4× using Lanczos resampling. After resizing, the world‑file was recalculated with adjusted pixel size to maintain correct geospatial alignment.
Next, I applied an unsharp mask with specific parameters: radius 2, percent 150, and threshold 3. This sharpening technique enhanced edge definition without introducing excessive artifacts.
Gamma correction was then applied with γ = 0.8 to brighten midtones and improve overall visibility of vessel details.
I also experimented with other enhancements including vibrance, saturation, contrast, and white balance adjustments. However, these techniques did not meaningfully improve the images.
6. Final Output Structure
Sentinel‑2 imagery aligned to AIS vessel events was organised into:
- raw downloads
- upscaled images
- sharpened images
- gamma‑corrected images
- full geospatial metadata for each file
Once I had the images I used the points to path QGIS processing tool to genertate the vessel path. I used cruisemapper.com to find the port names alongside visiting dates. Plot development was all completed inside of QGIS.